The question
Help a reader compare four fictional categories using a shared baseline, clear labels and a visible explanatory note.
The visible decision
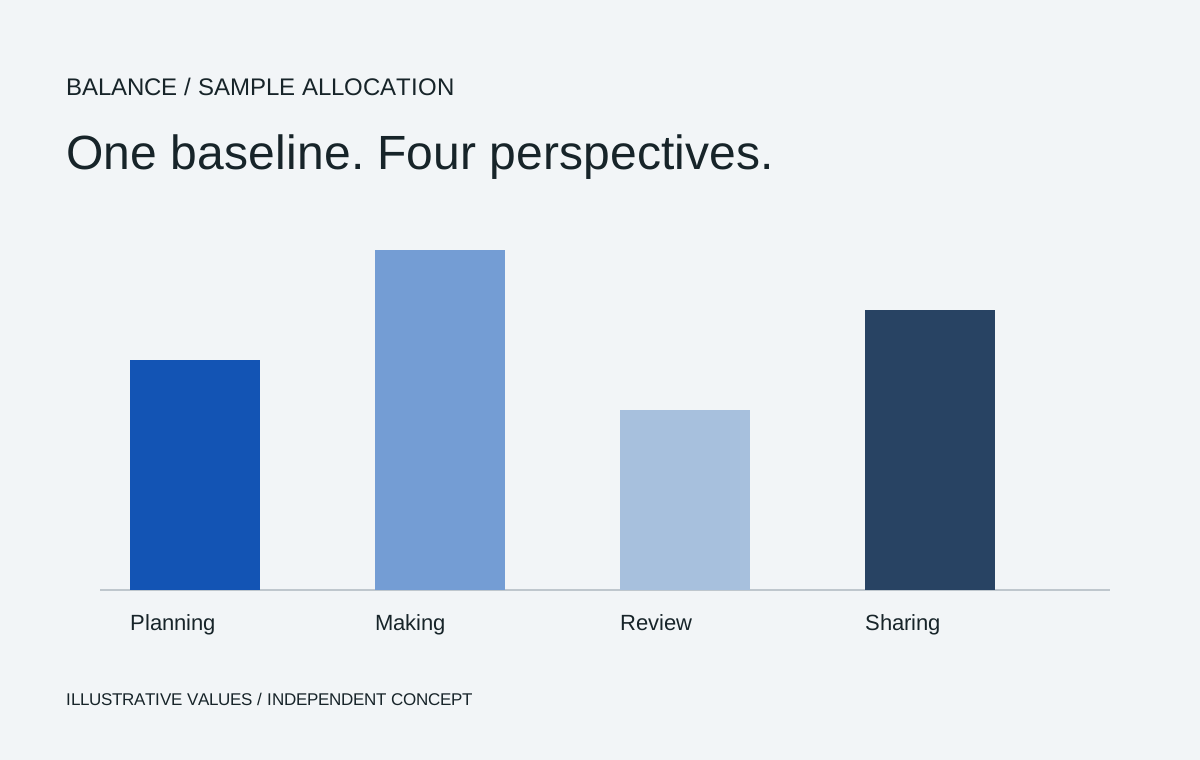
The chart keeps the same scale across all categories. Each column has a full category label, and a footer identifies the values as illustrative rather than business findings.
What the study contains
A comparative chart with four labelled categories and a shared baseline.
Actual source content, output requirements and approval responsibilities would be defined for a commissioned project. This study explains the design shown here.
Discuss a related project ↗